Comparing the Carbon Footprint of Transportation Options
Comparing the Carbon Footprint of Transportation Options
The Carbon Footprint of Transportation
As concern about climate change has grown, individuals are becoming increasingly conscious of their impact on the environment.
Transportation emissions often make up the largest portion of our individual carbon footprints. For that reason, evaluating transport options is a natural place to start, whether it is for a daily commute or a leisure trip abroad.
So, what’s the most eco-friendly way to go from one place to another?
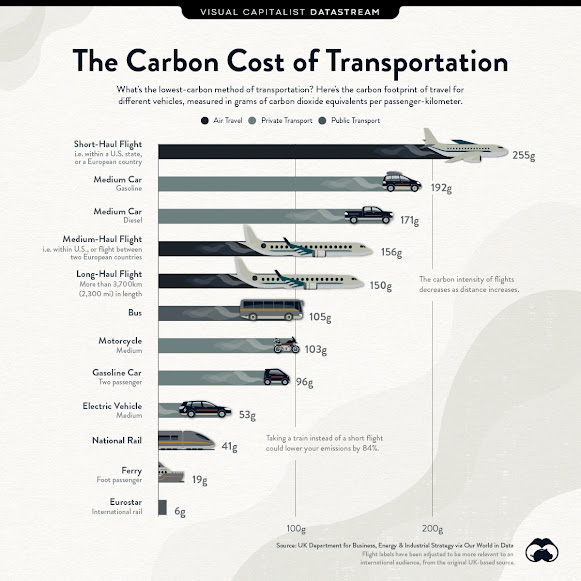
The above infographic charts the carbon footprint of transportation per passenger-kilometer for different vehicles based on data from the UK Government’s methodology paper for greenhouse gas reporting.
Editor’s note: Because the original labels in the study are very UK-specific, we have changed the copy of some of the labels to better suit an international audience.
Planes, Trains and Automobiles: How Carbon Footprints Compare
The carbon footprint of transportation is measured in grams of carbon dioxide (CO2) equivalents emitted per person to travel one kilometer. This includes both carbon dioxide and other greenhouse gases.
Here’s how the carbon cost of travel compares for different means of transport:
| Means of Transport | CO2 equivalent emissions per passenger km |
|---|---|
| Short Flight | 255g |
| Medium Car (Gasoline) | 192g |
| Medium Car (Diesel) | 171g |
| Medium Flight | 156g |
| Long Flight | 150g |
| Bus | 105g |
| Medium Motorcycle | 103g |
| Gasoline Car (Two Passenger) | 96g |
| Medium Electric Vehicle | 53g |
| National Rail | 41g |
| Ferry | 19g |
| Eurostar (International Rail) | 6g |
Flying on a short flight or driving alone are the most carbon-intensive travel methods. However, adding one more passenger to your car ends up cutting the emissions in half, making driving more efficient.
Specifically, it’s worth breaking down categories of flights more, as their emissions depend greatly on their route length:
- Short Flights: For example, domestic flights within a European country, or flights within a U.S. state have the highest individual carbon footprint.
- Medium Flights: For example, international travel within Europe, or between U.S. states, have a significantly lower carbon footprint per person.
- Long Flights: Flights over 3,700 km (2,300 mi), about the distance from Los Angeles to New York, have the lowest carbon footprint per person.
Why are longer flights far more eco-friendly than short-range flights? It’s because take-off uses much more energy than the ‘cruise’ phase of a flight. For short flights, the efficient cruise phase is relatively short-lived.
Shrinking Your Travel Footprint
As the world works to mitigate the impact of climate change, people may want to identify and potentially reduce their daily carbon footprint. And choosing your method of transportation is one way to do so.
Of course, walking, biking, or running are the lowest-carbon ways to go from one place to another. But car-sharing can also reduce emissions, as can switching to electric vehicles or public transport.
Over medium-to-long distances, trains are the most eco-friendly option, and for short-range domestic travel, driving is better than taking a flight. But as some countries are bigger than others, always consider the total distance you need to travel, and the breadth of options you have available.


Comments
Post a Comment